JavaScript Rendering Depth as a Tool Reliability Signal in Autonomous Agent Loops
Incomplete page observations silently break agent reasoning loops.
Most agent failures are not crashes. They are confident answers built on observations that were never complete in the first place. The problem starts at the observe step, where a fetch tool returns an empty shell and the agent never notices. Rendering depth is how far a tool goes before returning content, so it predicts that failure before it happens.
Why JS-rendered SPAs create a silent failure mode in agent observe-plan-act loops
An agent loop runs on three steps: observe, plan, act. The agent fetches a page, reasons over what it received, then takes an action based on that reasoning. Most reliability engineering for agents focuses on the plan and act steps. Bad tool calls, hallucinated parameters, retry loops. But a failure at the observe step poisons everything downstream, because every later step trusts what the observation reported.
Most modern websites are single-page applications. The server ships a near-empty HTML shell with a script bundle. The browser executes that JavaScript, fetches data, builds the DOM, and paints the page. Pricing tables, product listings, dashboards, reviews, all of it materializes after the code runs, not before. A static HTTP fetch returns only the shell the server sent.
The failure is silent. The tool call returns HTTP 200. The agent receives a response. Nothing in the scaffolding signals that the observation is incomplete. Scrapfly's 2026 agent guide names JS-rendered content as one of the primary fetch-layer failure modes: selectors visible in DevTools never appear in the raw response, so the agent replans around an empty page.
What follows is worse than a crash. The agent passes the empty shell to the model as if it were the page. The model cannot find the requested fields, so it either hallucinates a CSS path or concludes the data does not exist. Both outcomes carry high expressed confidence. A crash would at least surface the error. It propagates forward into every downstream reasoning step before any error becomes visible.
What rendering depth actually measures and why it predicts observation completeness
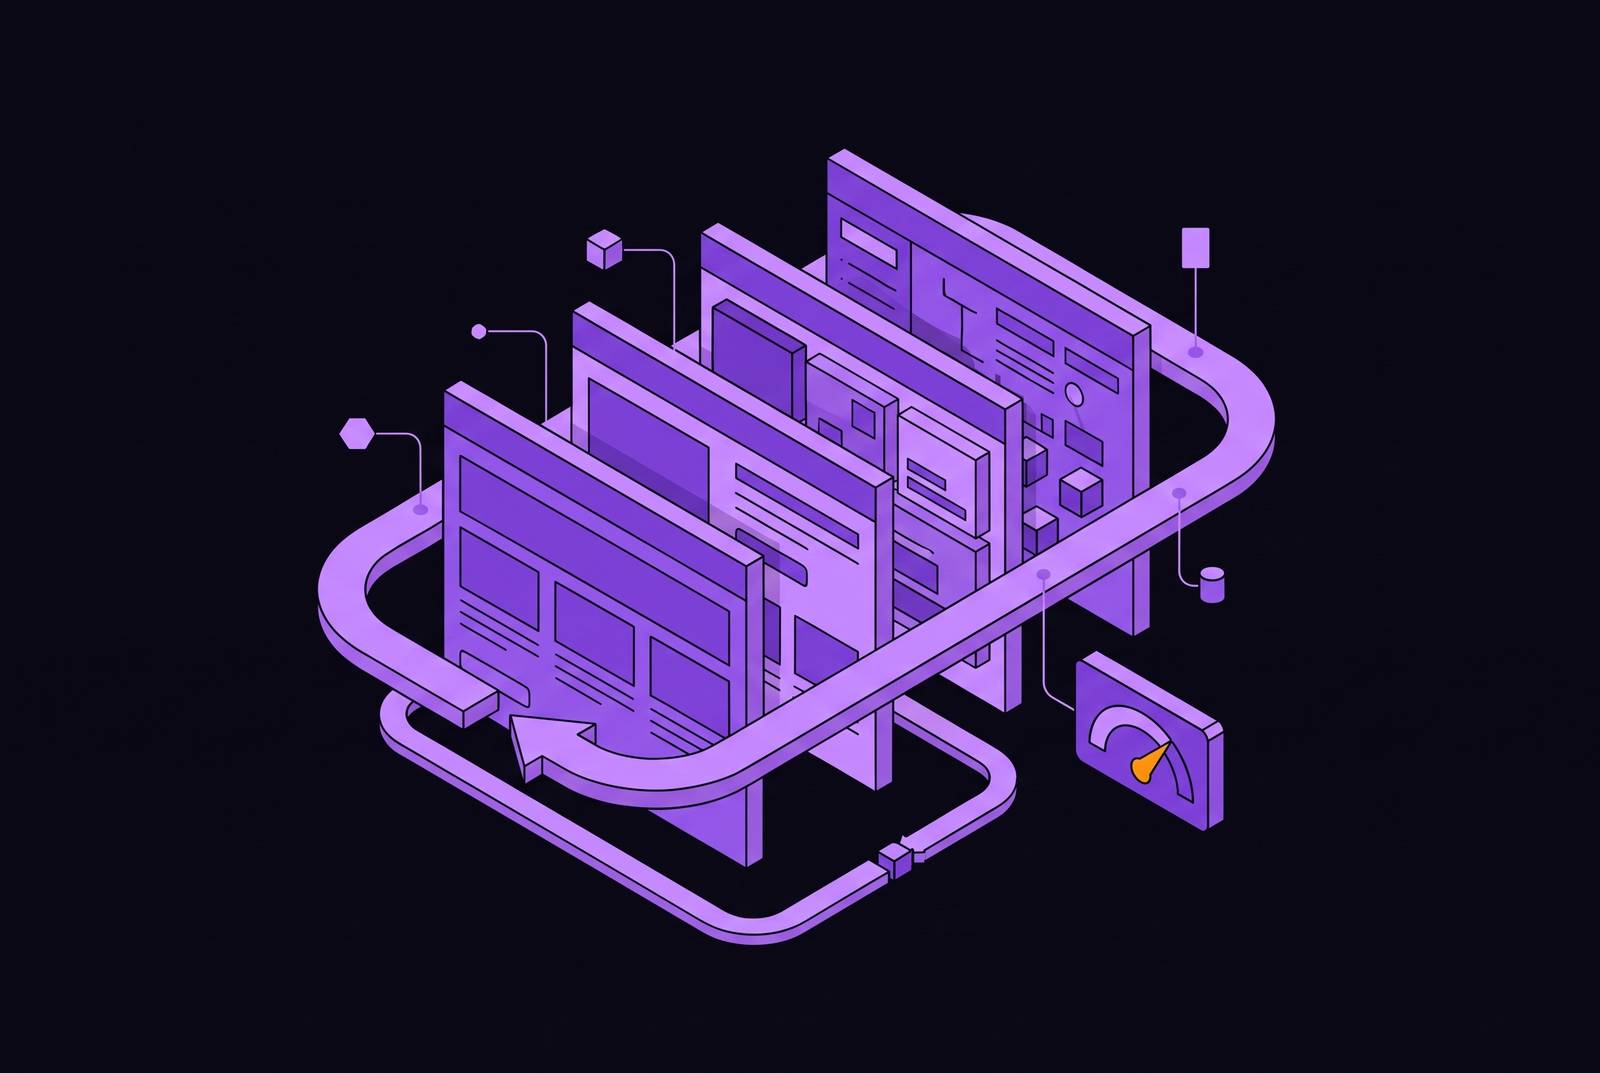
Rendering depth is how far along the browser execution stack a fetch tool goes before returning content. The spectrum runs from raw HTTP response, to parsed static HTML, to partial JavaScript execution, to full DOM construction, to post-interaction settled state. Each level corresponds to a different completeness ceiling for the observation the agent receives.
At the shallow end, a raw HTTP fetch returns the server's initial document. On a single-page application, that is the empty shell. The tool has not executed a line of JavaScript, so any content that JavaScript would produce is missing by definition. A full headless render goes further: it executes the JavaScript bundle, waits for network calls to resolve, and produces the DOM a human browser would display. A post-interaction render adds clicks, scroll events, or form submissions before capturing that DOM.
This makes rendering depth a proxy for observation completeness. If you know the target site, a tool's depth setting predicts the upper bound of content it can return. That is the useful property. Context.dev's 2026 guide frames this directly: static HTTP fetchers hand back a shell, while rendering requires a real browser engine that executes JavaScript, waits for network calls to resolve, and produces the finished DOM.
The key difference from other diagnostics is timing. A tool's depth level is a declared or detectable property of the tool itself, not an output to infer after a call has already failed. You can know before making the call whether the response has any chance of containing the content you need. That pre-call measurability is what qualifies rendering depth as a reliability signal rather than a post-hoc diagnostic.
How the four main agent shapes each expose rendering depth as a different kind of vulnerability
Rendering depth is not a single universal risk. Its consequence varies by agent shape, and each shape has a characteristic failure signature. Research and RAG ingestion agents fetch many pages to build or refresh a retrieval index. Incomplete renders produce documents that look populated but are missing the content fields that would be retrieved later. The degradation is silent: the model answers confidently from incomplete embeddings, and the error is invisible until a human notices a wrong answer. Context.dev's LLM pipeline guide frames this precisely: a cached snapshot from last quarter produces an answer that sounds right and describes a reality that no longer exists. A web context API that guarantees full rendering produces documents with complete content fields for retrieval, so the silent degradation from cached or partially-rendered snapshots does not happen.
Structured extraction agents face a sharper version of the same problem. Schema-driven pipelines expect typed fields, price, availability, author, that only exist in the DOM after JavaScript runs. When the render is shallow, the schema cannot be satisfied. The pipeline may return nulls, default values, or silently drop records. The report looks complete, but the fields that matter were never observed.
Website monitoring and change-detection agents fail by design. They compare successive snapshots to detect updates. A shallow render captures only the static shell, so changes in JS-rendered content are never observed and never trigger alerts. Scrapfly's agent guide notes that most modern sites load content with JavaScript, so a tool that downloads only raw HTML misses significant portions of monitored content. The agent reports no change because it cannot see the content that changed.
LLM CLI co-pilots, Claude Code, Gemini CLI, Grok Build, custom MCP clients, make this a default-broken condition for the fastest-growing class of agentic developer tooling. The first JS-rendered or anti-bot-protected page the co-pilot encounters produces a silent hollow observation. Scrapfly's 2026 agent guide covers this shape and notes that built-in fetch tools fail on JS-rendered pages, prescribing the Scrapfly CLI as a skill as the fix.
Why treating rendering depth as a routing signal is more useful than always maximizing it
The naive response to shallow-render failures is to always request the deepest available render. That is the wrong abstraction, because it compounds latency and token cost across every iteration of the agent loop. Agents make multiple LLM calls per run. Per-call latency and token cost scale with iteration count. A full headless render at every fetch multiplies both dimensions across the entire run, not just the one call. Scrapfly's agent guide flags unbounded retry loops as the single biggest cost driver in agent runs, and unnecessary deep renders feed that loop.
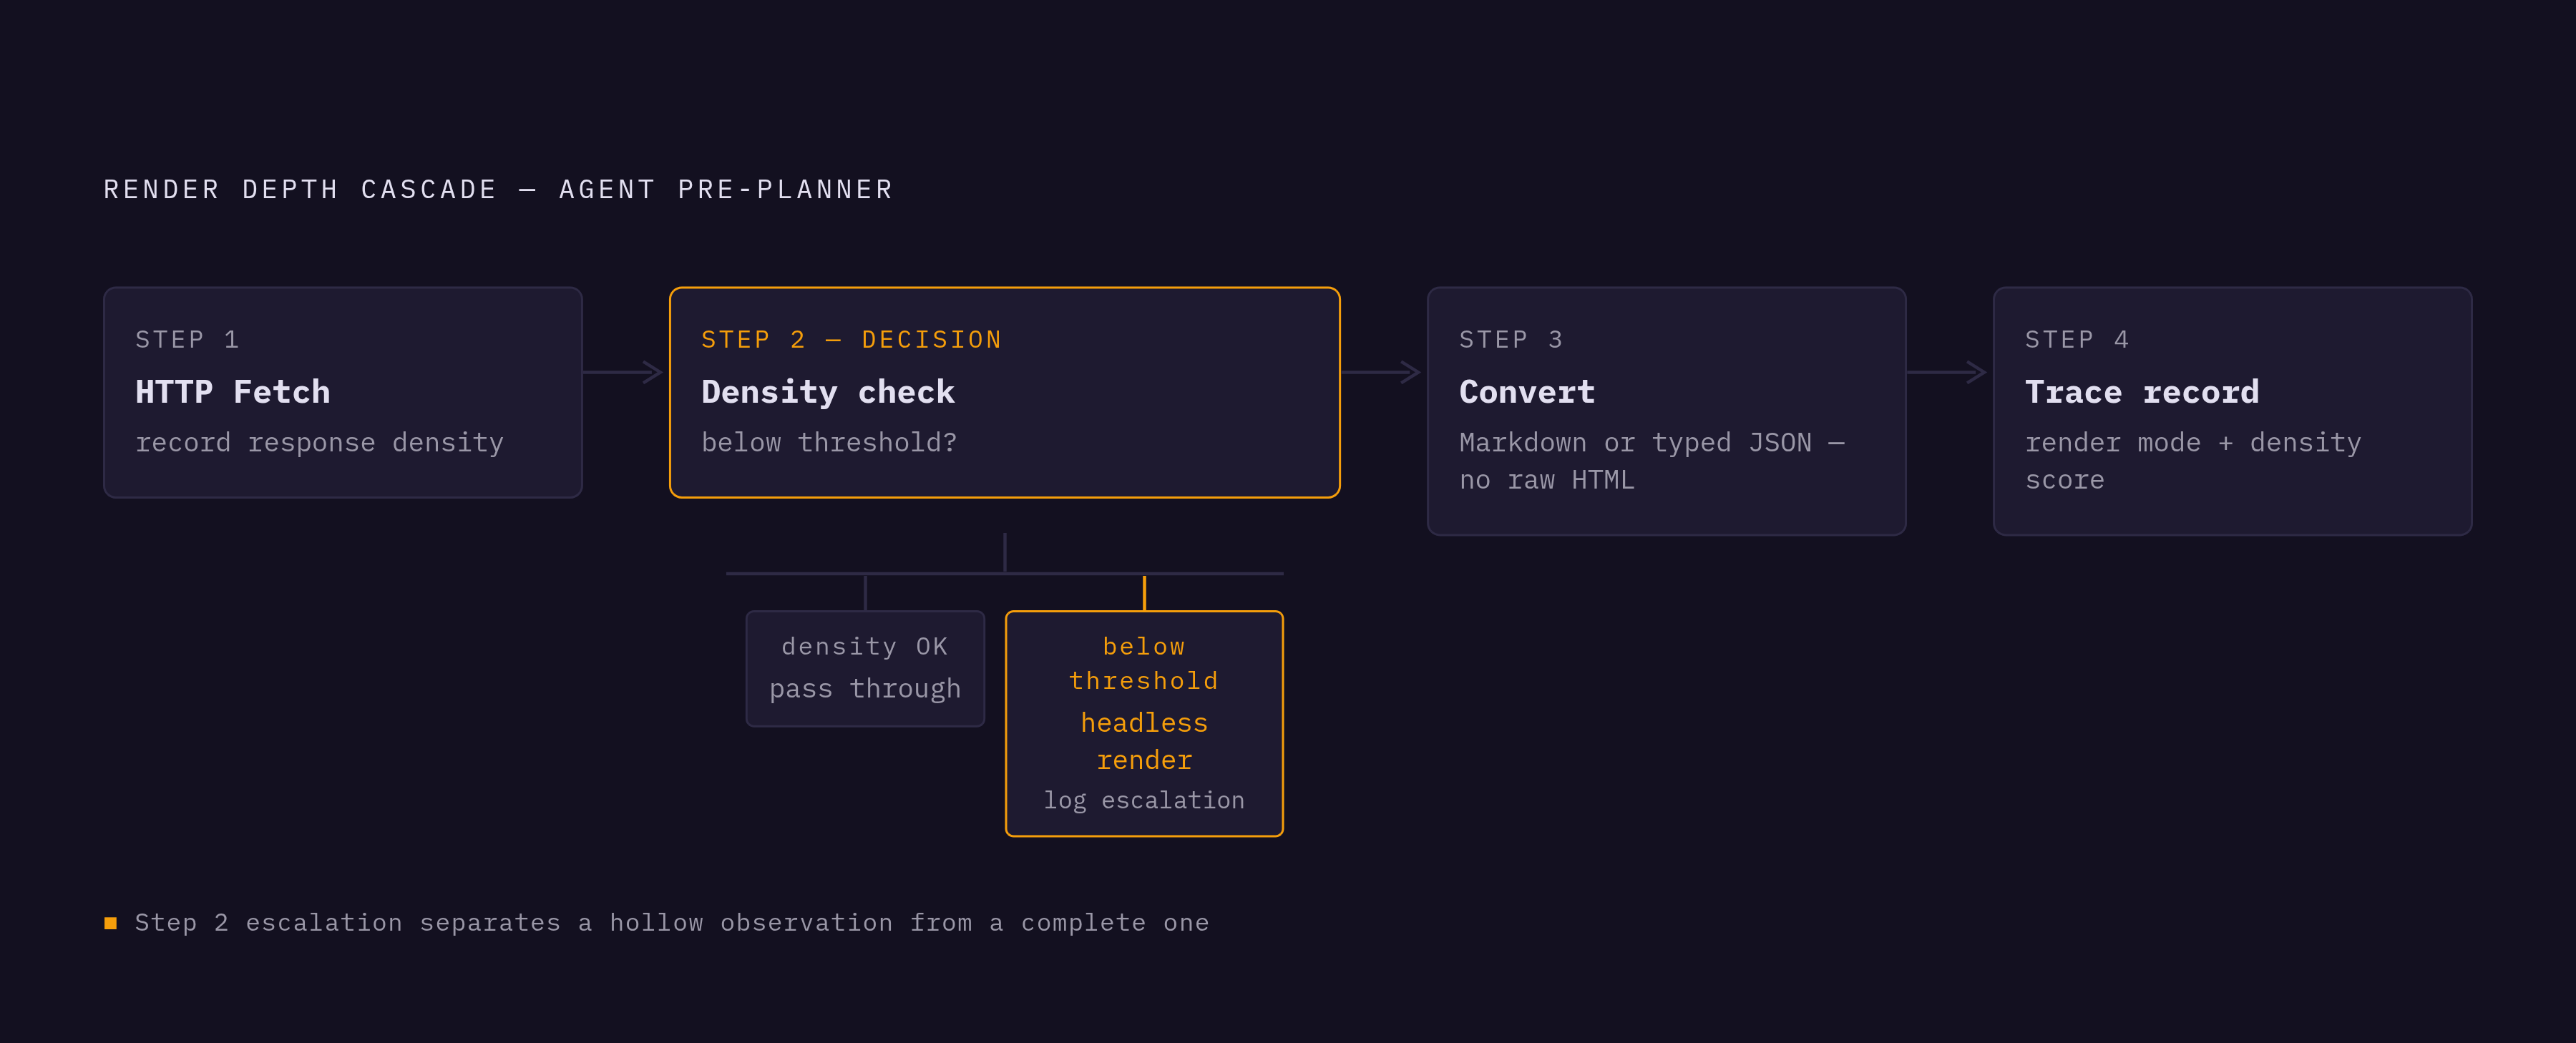
The cost objection is real, but it points to the wrong remedy. The cost of a confident misobservation, hallucinated selectors, propagated wrong answers, retry cascades, exceeds the cost of a selective deep render. The correct resolution is a tiered cascade: HTTP-first fetch, then escalate to headless render when a density or content signal indicates the response is hollow.
Rendering depth should work as a routing signal, not a universal setting. The tool wrapper, or the agent itself, inspects response density: field count, token-to-noise ratio, presence of expected structural markers. Only when that signal indicates content is missing does the system fire a browser render. This reframe preserves the reliability benefit while controlling the cost. Deep rendering becomes the exception invoked by a diagnostic, not the default paid on every call.
A second objection is worth naming cleanly. Rendering depth is not the only reliability axis. An agent can achieve full rendering and still fail on selector hallucination, session expiry, anti-bot interception, or geo-localization mismatch. Scrapfly's agent guide enumerates these as separate failure modes: anti-bot blocking, DOM mutation, session loss, geo mismatch, captcha loops. The answer is not that rendering depth covers everything. It is that rendering depth is one of the few tool-layer signals that is both measurable before the call and directly predictive of observation completeness. That makes it an unusually clean candidate for a reliability metric in an otherwise opaque stack.
What rendering depth signals look like in practice across tool architectures
Different tool architectures expose rendering depth at different layers of control. Where the routing decision lives depends on where the depth setting is controlled. Open-source frameworks put the control entirely in the developer's hands. Scrapfly's 2026 browser agent guide identifies Playwright as the deterministic base most agent frameworks build on. It ships with full JavaScript execution, network interception, and device emulation. Browser Use pairs with any LLM and provides LLM-driven browser control, and it has grown to a large GitHub following, leading the Odysseys leaderboard per Scrapfly's browser agent roundup. With self-hosted frameworks, the routing decision, when to render, is entirely the developer's responsibility. There is no automatic detection layer. Self-hosting also means the rendering container is a second reliability dependency. When it goes down, monitoring or extraction stops silently.
Managed rendering APIs make rendering depth a declared contract. Some make it a per-call parameter, a flag to enable or disable headless rendering, leaving the routing decision to the caller. Others take the opposite approach. Context makes full JavaScript rendering and DOM construction a built-in property of its fetch pipeline rather than an afterthought, so the observation an agent receives is the finished page, not an empty shell. Its Scrape endpoint always renders JavaScript and has no HTTP-only toggle. Rendering depth is a fixed contract rather than a variable, which removes the routing decision from the caller but commits a browser render on every call regardless of page type. The guide recommends making the HTTP-first decision before sending URLs to Context when avoiding browser work on static pages is architecturally important.
The fixed-depth approaches also address the output format problem. Context returns clean Markdown or schema-shaped JSON with navigation, ads, and boilerplate stripped, so it directly addresses the token-waste problem that makes raw HTML costly in agent loops. Its mainContentOnly parameter further reduces noise for embedding pipelines. Because rendering depth is a measurable, declared property of the tool before a call is made, it becomes actionable as a reliability signal, and APIs like Context make that depth explicit in their contract so teams can reason about whether a given fetch will return the structured content their agent actually needs. For agents that need structured typed fields rather than Markdown, schema-shaped JSON output means the rendering layer and the extraction layer are handled in a single call, removing one more infrastructure dependency from the agent stack.
Computer-vision-based agents shift the signal entirely. For an architecture like Skyvern, rendering depth becomes a visual completeness question rather than a DOM question. The signal moves from "did the JavaScript execute" to "does the screenshot contain the expected visual content."
The MCP and CLI co-pilot surface closes the loop. For LLM CLI co-pilots, the rendering gap must be closed by attaching an external tool, a scraping API exposed as an MCP server or CLI skill, because the built-in fetch has no rendering layer. Scrapfly's agent guide maps this explicitly: the LLM CLI co-pilot shape requires an external rendering surface installed as a skill or connected via the Scrapfly MCP server. Context exposes its capability through MCP, so Claude or Cursor can pull rendered web content as a native tool without glue code, per Context.dev's real-time content guide.
How to instrument rendering depth as a first-class metric in an agent's reliability stack
Making rendering depth a first-class reliability signal means capturing it in the agent's trace, not inferring it after a failure. The tool-call boundary is where that capture belongs. Record four things at each fetch. First, the render mode requested: HTTP-only, headless, or post-interaction. Second, the response density signal: token count of the returned content, presence of expected structural markers such as target field names, and the ratio of content tokens to boilerplate tokens. Third, whether a render escalation was triggered and what signal caused it. Fourth, the tool call outcome independent of HTTP status. A 200 with an empty shell is a different reliability event than a 200 with a fully populated DOM.
Density scoring is the practical escalation trigger. A simple heuristic works: if the returned content falls below a token-count threshold, or lacks any of the schema fields the agent expects, flag the observation as potentially hollow and escalate to a deeper render before passing it to the planner. This keeps the routing decision automated and auditable rather than hard-coded as "always render."
Rendering depth earns its place alongside other reliability metrics because most of those are post-hoc. Task success rate, tool-call correctness, hallucination on intermediate steps, plan adherence, trace length, and unrecoverable-error rate all measure what already happened. Rendering depth is measurable before the call. Instrumenting it does not replace the others. It gives you an early warning before the downstream metrics degrade.
The output format completes the signal. Rendering depth determines whether content arrives at all. Output format determines whether the model can reason over it efficiently. Raw HTML, even fully rendered, is a reliability liability. Navigation chrome, cookie banners, and tracking scripts consume tokens and dilute the content signal. A fully rendered response converted to clean Markdown or schema-shaped JSON before it enters the context window closes the second gap: the observation is complete and parseable, not complete and noisy. Context.dev's pipeline guide makes this point in terms of token efficiency: raw HTML inflates the token count and drowns the model in noise, while a Markdown or clean JSON response keeps prompts lean and accurate.
The cascade pattern comes together in four steps. Step one: attempt the HTTP fetch and record response density. Step two: if density falls below threshold, escalate to headless render via a managed API or attached rendering tool, and record the escalation event in the trace. Step three: convert rendered content to Markdown or typed JSON before passing it to the planner, never pass raw HTML. Step four: record render mode and density score alongside the observation in the agent trace so post-run analysis can correlate fetch-layer reliability with downstream task outcomes. That correlation is what turns rendering depth from a setting into evidence.